前言
自从开始了这个ELK专题之后, 笔者就一直都在Elastic Stack的框架下介绍里面的各种应用. 目前有覆盖到的有Elasticsearch, Logstash, Kibana, Beats(filebeat, metricbeat), 但是在真实的生产环境下, 做技术选型的时候往往还会依据现实的需要加入其它类型的中间件. 比如说, 为了进一步加强日志系统集群的健壮性, 我们还可以考虑增加一个消息队列的中间件.
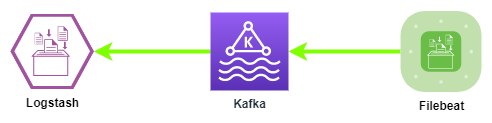
在本文中, 我们就尝试着为ELK集群增加一个Kafka.
需要说明的是, 在前面的章节中介绍到的方案, 会把原始日志里面的json内容当做是纯文本去处理, 去到Logstash的时候再识别成json格式, 过程显得繁琐.
在最后的拾遗部分, 会再提供一个简便一点的方案.
why kafka?
在我们之前讨论的示例中, 使用下面的架构图:
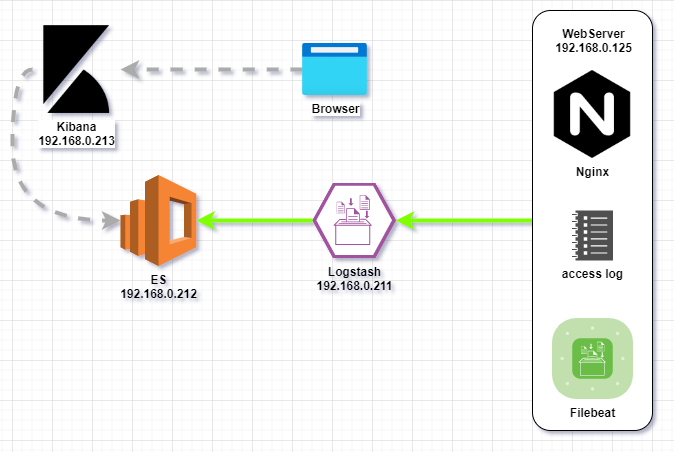
在实验环境中, 只需要考虑技术可行性, 业务端的服务器直接使用filebeat向logstash传输日志数据, 这是完全没问题的. 但在生产环境下, 往往是有大量的服务器在不断产生日志和事务数据, 最终都通过网络汇聚到Logstash的Input模块中, 一旦Logstash来不及处理这些海量的数据, 就会形成单点压力.
尽管Logstash具备横向扩容和队列持久化的能力(挖一个坑), 但为了可以更好地应对计划外的流量激增或者是组件故障, 又或者是为了在ES升级的时候不中断日志的接收, 我们可以考虑在Filebeat和Logstash之间增加一个Kafka集群, 作为缓冲池使用.
除了削峰之外, Kafka还可以通过自身的topic功能, 进一步对日志或者事务分开管理和传输, 提高管理的粒度.
可行性验证
实验环境概述
为了简化实验环境, 本文主要讲述从日志文件到Logstash的过程, 对ES部分将会略过.
版本说明
在本文中, 涉及到的相关程序组件版本如下:
| 组件 |
版本 |
| Filebeat |
7.10 |
| Kafka |
1.1.1 |
| Logstash |
7.10 |
关于其他版本的兼容性情况, 可以参考下面的链接:
https://www.elastic.co/cn/support/matrix#matrix_compatibility
https://www.elastic.co/guide/en/beats/filebeat/7.10/kafka-output.html#kafka-compatibility
实验日志
同样为了简化实验环境, 测试用的日志使用一个简单的shell脚本去生成, 脚本log-generator.sh内容如下:
1
2
3
4
5
6
7
8
9
10
11
12
13
14
15
16
17
18
19
20
21
|
while [ 1 ]
do
waitTime=$(shuf -i 1-5 -n 1)
sleep $waitTime &
wait $!
instruction=$(shuf -i 0-4 -n 1)
d=`date -Iseconds`
case "$instruction" in
"1") echo "{\"log_date\": \"$d\", \"level\": \"ERROR\", \"message\": \"something happened in this execution.\"}"
;;
"2") echo "{\"log_date\": \"$d\", \"level\": \"INFO\", \"message\": \"takes the value and converts it to string.\"}"
;;
"3") echo "{\"log_date\": \"$d\", \"level\": \"WARN\", \"message\": \"variable not in use.\"}"
;;
"4") echo "{\"log_date\": \"$d\", \"level\": \"DEBUG\", \"message\": \"first loop completed.\"}"
;;
esac
done
|
运行示例如下:
1
2
3
4
5
6
| $ ./log-generator.sh
{"log_date": "2022-06-30T11:45:09+08:00", "level": "DEBUG", "message": "first loop completed."}
{"log_date": "2022-06-30T11:45:13+08:00", "level": "WARN", "message": "variable not in use."}
{"log_date": "2022-06-30T11:45:22+08:00", "level": "ERROR", "message": "something happened in this execution."}
{"log_date": "2022-06-30T11:45:26+08:00", "level": "WARN", "message": "variable not in use."}
{"log_date": "2022-06-30T11:45:31+08:00", "level": "WARN", "message": "variable not in use."}
|
使用Filebeat把日志内容输出到Kafka
产生实验用的日志内容
我们简单使用一个重定向命令把log-generator.sh的日志输出到一个文件:
1
| ./log-generator.sh > /tmp/test-log.log
|
完成Filebeat实验用配置
在本文的demo中, 我们直接直接下载Filebeat的二进制包进行实验, 官网下载地址:
https://www.elastic.co/cn/downloads/past-releases/filebeat-7-10-2
配置好Filebeat, 把日志内容输出到Kafka. Filebeat示例配置如下, 保存为filebeat-test.yml:
1
2
3
4
5
6
7
8
| filebeat.inputs:
- type: log
enabled: true
paths:
- /tmp/test-log.log
output.kafka:
hosts: ["10.3.2.7:9092"]
topic: 'rondo-test-topic'
|
使用命令行启动一个临时的filebeat进程, 把日志内容输出到kafka:
1
| ./filebeat -c ./filebeat-test.yml
|
在Kafka查看消息内容
Kafka安装路径下会自带一个命令行工具可以直接查看topic中的消息内容, 在指定kafka的主机地址和topic后, 我们可以看到log-generator.sh产生的日志会在kafka的topic中滚动刷新:
1
2
3
4
5
6
| # ./kafka-console-consumer.sh --bootstrap-server 10.3.2.7:9092 --topic rondo-test-topic
{"@timestamp":"2022-06-30T06:55:13.859Z","@metadata":{"beat":"filebeat","type":"_doc","version":"7.10.2"},"ecs":{"version":"1.6.0"},"host":{"name":"ops-machine"},"agent":{"type":"filebeat","version":"7.10.2","hostname":"ops-machine","ephemeral_id":"36df58bf-80ce-4df7-84d1-cba84b6994e5","id":"648f3982-e9d6-4a60-9afd-737e32950b5d","name":"ops-machine"},"log":{"offset":0,"file":{"path":"/tmp/test-log.log"}},"message":"{\"log_date\": \"2022-06-30T14:54:18+0800\", \"level\": \"ERROR\", \"message\": \"something happened in this execution.\"}","input":{"type":"log"}}
{"@timestamp":"2022-06-30T06:55:13.859Z","@metadata":{"beat":"filebeat","type":"_doc","version":"7.10.2"},"ecs":{"version":"1.6.0"},"host":{"name":"ops-machine"},"agent":{"name":"ops-machine","type":"filebeat","version":"7.10.2","hostname":"ops-machine","ephemeral_id":"36df58bf-80ce-4df7-84d1-cba84b6994e5","id":"648f3982-e9d6-4a60-9afd-737e32950b5d"},"log":{"offset":111,"file":{"path":"/tmp/test-log.log"}},"message":"{\"log_date\": \"2022-06-30T14:54:22+0800\", \"level\": \"ERROR\", \"message\": \"something happened in this execution.\"}","input":{"type":"log"}}
{"@timestamp":"2022-06-30T06:55:13.859Z","@metadata":{"beat":"filebeat","type":"_doc","version":"7.10.2"},"input":{"type":"log"},"ecs":{"version":"1.6.0"},"host":{"name":"ops-machine"},"agent":{"hostname":"ops-machine","ephemeral_id":"36df58bf-80ce-4df7-84d1-cba84b6994e5","id":"648f3982-e9d6-4a60-9afd-737e32950b5d","name":"ops-machine","type":"filebeat","version":"7.10.2"},"message":"{\"log_date\": \"2022-06-30T14:54:25+0800\", \"level\": \"DEBUG\", \"message\": \"first loop completed.\"}","log":{"offset":222,"file":{"path":"/tmp/test-log.log"}}}
...
|
抽取其中一条消息, 用json格式化后, 内容如下:
1
2
3
4
5
6
7
8
9
10
11
12
13
14
15
16
17
18
19
20
21
22
23
24
25
26
27
28
29
30
31
32
| {
"@timestamp": "2022-06-30T07:20:45.995Z",
"@metadata": {
"beat": "filebeat",
"type": "_doc",
"version": "7.10.2"
},
"input": {
"type": "log"
},
"ecs": {
"version": "1.6.0"
},
"host": {
"name": "ops-machine"
},
"agent": {
"type": "filebeat",
"version": "7.10.2",
"hostname": "ops-machine",
"ephemeral_id": "36df58bf-80ce-4df7-84d1-cba84b6994e5",
"id": "648f3982-e9d6-4a60-9afd-737e32950b5d",
"name": "ops-machine"
},
"log": {
"offset": 44977,
"file": {
"path": "/tmp/test-log.log"
}
},
"message": "{\"log_date\": \"2022-06-30T15:20:44+0800\", \"level\": \"ERROR\", \"message\": \"something happened in this execution.\"}"
}
|
↑在默认配置下, filebeat在向kafka投递消息的时候, 除了日志内容, 还会附带有日志的文件和偏移量, 以及filebeat所在的主机的信息等.↑
使用Logstash订阅Kafka中的消息
运行一个临时Logstash进程
和filebeat的操作类似, 我们可以直接下载一个Logstash的二进制文件进行实验, 下载链接:
https://artifacts.elastic.co/downloads/beats/filebeat/filebeat-7.10.2-linux-x86_64.tar.gz
Logstash管道配置
在本例中, Logstash使用如下管道配置, 保存为logstash-test-pipe.conf:
1
2
3
4
5
6
7
8
9
10
11
12
| input {
kafka {
bootstrap_servers => ["10.3.2.7:9092"]
auto_offset_reset => "latest"
consumer_threads => 5
decorate_events => true
topics => ["rondo-test-topic"]
}
}
output {
stdout { codec => rubydebug }
}
|
运行Logstash查看输出
使用命令直接调用临时配置文件运行Logstash:
1
| ./bin/logstash -f ./config/conf.d/logstash-test-pipe.conf
|
Logstash进程完成初始化后, 就会按照配置的内容访问kafka并且读取topic中的消息, 最后按照配置的内容以ruby格式排版, 输出kafka里面的内容:
1
2
3
4
5
| {
"@version" => "1",
"@timestamp" => 2022-06-30T07:20:46.999Z,
"message" => "{\"@timestamp\":\"2022-06-30T07:20:45.995Z\",\"@metadata\":{\"beat\":\"filebeat\",\"type\":\"_doc\",\"version\":\"7.10.2\"},\"input\":{\"type\":\"log\"},\"ecs\":{\"version\":\"1.6.0\"},\"host\":{\"name\":\"ops-machine\"},\"agent\":{\"type\":\"filebeat\",\"version\":\"7.10.2\",\"hostname\":\"ops-machine\",\"ephemeral_id\":\"36df58bf-80ce-4df7-84d1-cba84b6994e5\",\"id\":\"648f3982-e9d6-4a60-9afd-737e32950b5d\",\"name\":\"ops-machine\"},\"log\":{\"offset\":44977,\"file\":{\"path\":\"/tmp/test-log.log\"}},\"message\":\"{\\\"log_date\\\": \\\"2022-06-30T15:20:44+0800\\\", \\\"level\\\": \\\"ERROR\\\", \\\"message\\\": \\\"something happened in this execution.\\\"}\"}"
}
|
结合实际运维需求的优化
经过上面内容的一系列操作, 我们已经完成了从日志到Kafka再到Logstash的操作, 确定了这个消息流已经打通. 但正如笔者多次强调的一点, 在现实的生产环境下, 仅仅是有这样一个demo是不够的, 我们往往需要考虑很多现实的需求.
就以当前这个demo为例子, 我会想到下面几点需求:
在Filebeat向kafka投放日志消息的时候, 最好可以带上一些自定义字段, 在不劳烦开发组的情况下, 依据业务需求增加自定义字段. 比如说, 添加一个环境标签.
同样, 也需要删减一些不必要的日志内容, 以节省数据库空间.
最重要的一点, 日志内容是Json格式的, 需要把字段都识别出来, 以便于ES对字段内容进行检索和统计.
Filebeat配置优化
经过优化后, 使用的filebeat配置如下:
1
2
3
4
5
6
7
8
9
10
11
12
13
14
15
16
17
18
19
20
21
22
| filebeat.inputs:
- type: log
enabled: true
paths:
- /tmp/test-log.log
fields_under_root: true
fields:
env: UAT
processors:
- rename:
fields:
- from: "message"
to: "log-content"
output.kafka:
hosts: ["10.3.2.7:9092"]
topic: 'rondo-test-topic'
partition.round_robin:
reachable_only: true
required_acks: 1
bulk_max_size: 8192
compression: snappy
max_message_bytes: 100000
|
再次启动Filebeat后, Kafka中的消息内容举例如下:
1
2
3
4
5
6
7
8
9
10
11
12
13
14
15
16
17
18
19
20
21
22
23
24
25
26
27
28
29
30
31
32
33
| {
"@timestamp": "2022-07-01T07:40:20.903Z",
"@metadata": {
"beat": "filebeat",
"type": "_doc",
"version": "7.10.2"
},
"log-content": "{\"log_date\": \"2022-07-01T15:40:20+0800\", \"level\": \"ERROR\", \"message\": \"something happened in this execution.\"}",
"input": {
"type": "log"
},
"env": "UAT",
"host": {
"name": "ops-machine"
},
"agent": {
"hostname": "ops-machine",
"ephemeral_id": "130087ab-1dbc-479c-811d-93609c44aee8",
"id": "648f3982-e9d6-4a60-9afd-737e32950b5d",
"name": "ops-machine",
"type": "filebeat",
"version": "7.10.2"
},
"ecs": {
"version": "1.6.0"
},
"log": {
"offset": 4216,
"file": {
"path": "/tmp/test-log.log"
}
}
}
|
Logstash配置优化
Logstash的主要任务是解析Json并且删除不必要的字段, 最终输出到ES. 经过反复调试后, 使用的管道配置内容如下:
1
2
3
4
5
6
7
8
9
10
11
12
13
14
15
16
17
18
19
20
21
22
23
24
25
26
27
28
29
30
31
32
33
34
35
36
37
38
| input {
kafka {
bootstrap_servers => ["10.3.2.7:9092"]
client_id => "Logstash-1"
group_id => "rondo-test-consumer"
auto_offset_reset => "latest"
consumer_threads => 5
decorate_events => true
topics => ["rondo-test-topic"]
}
}
filter {
json {
source => "message"
target => "parsedJson"
add_field => {
"env" => "%{[parsedJson][env]}"
"log-path" => "%{[parsedJson][log][file][path]}"
"log-offset" => "%{[parsedJson][log][offset]}"
}
remove_field => "message"
}
json {
source => "[parsedJson][log-content]"
remove_field => ["parsedJson"]
}
date {
match => "log_date", "yyyy-MM-dd'T'HH:mm:ssZ"
}
}
output {
elasticsearch {
hosts => ["http://10.3.2.37:9200"]
user => "elastic"
password => "***********"
index => "rondo-test-%{+YYYY.MM}"
}
|
在Kibana查看结果
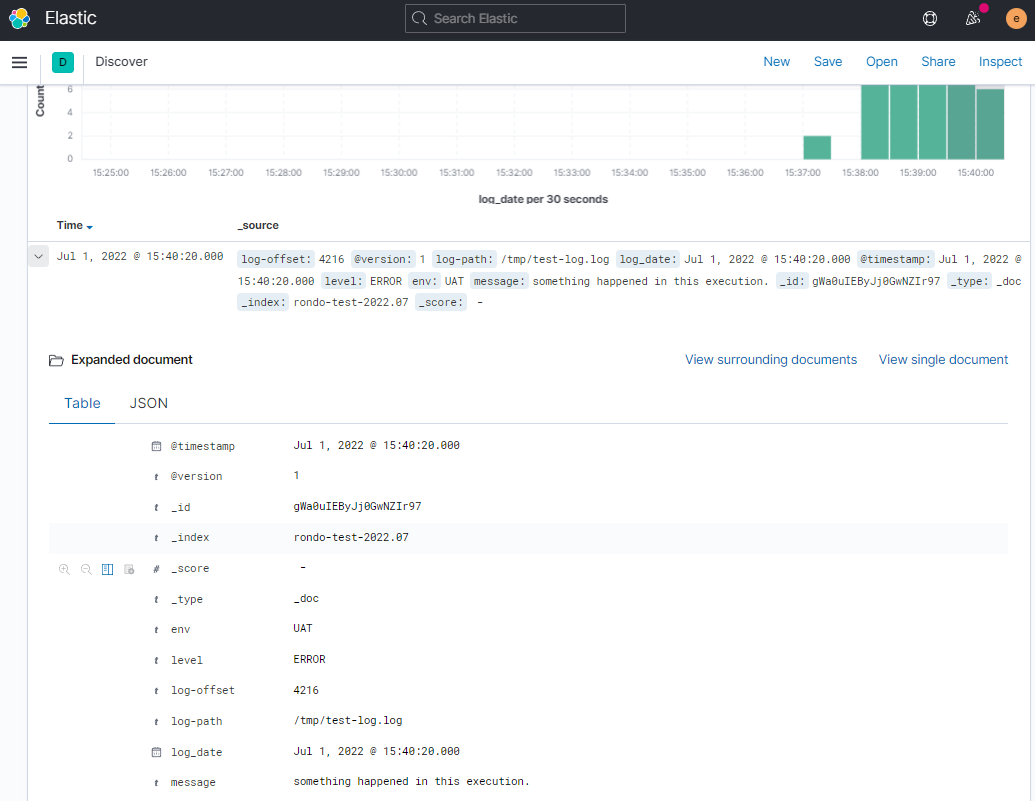
最终, 这一条日志数据在ES中被保存为下面的内容:
1
2
3
4
5
6
7
8
9
10
11
12
13
14
15
16
17
18
19
20
21
22
23
24
25
26
27
28
| {
"_index": "rondo-test-2022.07",
"_type": "_doc",
"_id": "gWa0uIEByJj0GwNZIr97",
"_version": 1,
"_score": null,
"_source": {
"log-offset": "4216",
"@version": "1",
"log-path": "/tmp/test-log.log",
"log_date": "2022-07-01T15:40:20+0800",
"@timestamp": "2022-07-01T07:40:20.000Z",
"level": "ERROR",
"env": "UAT",
"message": "something happened in this execution."
},
"fields": {
"@timestamp": [
"2022-07-01T07:40:20.000Z"
],
"log_date": [
"2022-07-01T07:40:20.000Z"
]
},
"sort": [
1656661220000
]
}
|
总结
经过一个简单的demo, 我们演示了从一条原始的json日志经过添加自定义字段, 被正确识别, 最后入库到ES, 再通过Kibana展示的过程, 在现实的生产环境中, 就算是内容再复杂一点的日志数据, 大致的处理过程也是这个框架, 也许在细节上会因应业务特点和一些性能上的考虑会有所调整.
在调试过程中, 对于比较麻烦的Json和时间戳部分, 只要善用stdout工具, 结合文档上说明, 耐心多调试几次就好.
在最初开始ELK专题的时候, 笔者曾经有想过要不要开局就带上kafka, 但后来考虑到调试的难度和篇幅, 就决定省了. 后来是考虑在加入kafka之前先尝试着对集群做一个压力测试, 以彰显一下kafka的作用, 但是如果要安排压力测试那就要花大量精力把监控做完善了才能看出效果, 懒癌发作之下, 就一直搁置了. 另外也咨询了一下同行, 大家都不常在这样的周边系统上花太多精力去优化, 一方面是现在云平台都有全套的日志分析产品卖, 直接买了之后完成业务相关的配置即可, 集群的运维都交给云平台了; 另一方面, 对比起业务本身的压力, 日志系统的压力往往都可以直接加钱扩容就能解决, 在KPI驱动的职场中, ELK的性能优化往往关注度不高.
后面如果笔者在工作中刚好遇到了相关的性能优化案例, 再上来分享.
拾遗
可以使用filebeat直接识别和处理json格式的日志
我们使用的filebeat测试配置如下:
1
2
3
4
5
6
7
8
9
10
11
| filebeat.inputs:
- type: stdin
encoding: utf-8
fields:
env: UAT
fields_under_root: true
json.keys_under_root: true
json.add_error_key: true
output.console:
pretty: true
|
运行filebeat测试后, 现象如下:
1
2
3
4
5
6
7
8
9
10
11
12
13
14
15
16
17
18
19
20
21
22
23
24
25
26
27
28
29
30
31
32
33
34
35
36
37
| [root@ops-machine filebeat-7.10.2-linux-x86_64]# ./filebeat -c ./filebeat_stdin.yml
{"log_date": "2022-06-30T11:45:09+08:00", "level": "DEBUG", "message": "first loop completed."}
{
"@timestamp": "2022-07-18T02:11:56.883Z",
"@metadata": {
"beat": "filebeat",
"type": "_doc",
"version": "7.10.2"
},
"host": {
"name": "ops-machine"
},
"agent": {
"ephemeral_id": "c40d3011-dfc4-428f-8bc0-6a687438b102",
"id": "7fa61d56-18b4-484a-9029-05f70933a351",
"name": "ops-machine",
"type": "filebeat",
"version": "7.10.2",
"hostname": "ops-machine"
},
"log": {
"offset": 0,
"file": {
"path": ""
}
},
"env": "UAT",
"level": "DEBUG",
"input": {
"type": "stdin"
},
"ecs": {
"version": "1.6.0"
},
"message": "first loop completed.",
"log_date": "2022-06-30T11:45:09+08:00"
}
|
↑我们可以看到, filebeat在输出的时候, 已经把日志内容识别成json格式了, 会直接在输出的消息里面用json格式对原始日志内容完成整合和排版.
删除多余字段
也很简单, 只需要在配置文件里面增加一个processor就可以了
1
2
3
4
5
6
7
8
9
10
11
12
13
14
15
| filebeat.inputs:
- type: stdin
encoding: utf-8
fields:
env: UAT
fields_under_root: true
json.keys_under_root: true
json.add_error_key: true
processors:
- drop_fields:
fields: ["agent","ecs","input","host"]
output.console:
pretty: true
|
对错误json内容的处理
我们使用上面的配置, 再运行一次filebeat, 输入一条不符合json格式规范的内容看看:
1
2
3
4
5
6
7
8
9
10
11
12
13
14
15
16
17
18
19
20
21
22
| [root@ops-machine filebeat-7.10.2-linux-x86_64]# ./filebeat -c filebeat_stdin.yml
{"log_date": "2022-06-30T11:45:09+08:00", "level": "DEBUG", "message": "first loop compl
{
"@timestamp": "2022-07-18T02:37:55.700Z",
"@metadata": {
"beat": "filebeat",
"type": "_doc",
"version": "7.10.2"
},
"message": "{\"log_date\": \"2022-06-30T11:45:09+08:00\", \"level\": \"DEBUG\", \"message\": \"first loop compl",
"env": "UAT",
"log": {
"offset": 0,
"file": {
"path": ""
}
},
"error": {
"message": "Error decoding JSON: invalid character '\\n' in string literal",
"type": "json"
}
}
|
↑可以看到, 当filebeat遇到不符合json格式规范的内容, 就直接把原始的内容放到message字段下. 另外, 因为配置了json.add_error_key: true, 所以还会在消息里面添加error.message和error.type字段, 记录错误的类型.
使filebeat忽略格式错误的json内容
续上, 如果不希望filebeat把不符合json规范的内容传送到output, 那我们可以再增加一个processor, 设置一个条件就可以:
1
2
3
4
| processors:
- drop_event:
when: # 设置drop_event的条件
has_fields: ['error.message']
|
↑当消息里面包含error.message这个字段的时候, 就执行drop_event操作.
Logstash接收包含json格式的消息
因为接收到的消息已经是json格式了, 处理起来就简便多了, 只需要明确告诉logstash哪个字段是json格式的就可以了. 完成识别之后还可以把原始的message移除掉, 使内容更简洁.
1
2
3
4
5
6
7
8
9
10
11
| filter {
json {
source => "message"
remove_field => "message"
}
date {
match => [ "log_date", "yyyy-MM-dd'T'HH:mm:ssZ" ]
timezone => "UTC"
}
}
|
扩展阅读
当然是看官方文档啦!
https://www.elastic.co/guide/en/beats/filebeat/7.10/drop-event.html
https://www.elastic.co/guide/en/beats/filebeat/7.10/filebeat-input-stdin.html
https://www.elastic.co/guide/en/beats/filebeat/7.10/defining-processors.html#conditions
https://www.elastic.co/guide/en/beats/filebeat/7.10/filebeat-installation-configuration.html