背景 在腾讯的企业版蓝鲸系统中, 有一个企业应用叫做”日志平台”, 后台数据库通过Elasticsearch实现.
近日笔者发现Elasticsearch集群所在的服务器出现了磁盘告警, 进行一番排查后, 发现有一个名为esb_api_log_community的索引, 里面累积了1.9亿个文档, 占用了127.7GB的空间. 再算上副本, 就奔250GB去了.
真是个吉利的数字, 需要修理修理了.
1
2
3
4
5
# curl -s -u username:password -X GET "192.168.255.108:9200/_cat/indices?v" health status index uuid pri rep docs.count docs.deleted store.size pri.store.size ... green open esb_api_log_community xxxxxxxxxxxxxxxxxxxxxx 1 1 192079624 0 254.8gb 127.7gb ...
TL;DR 如果你恰好跟笔者一样在使用企业版蓝鲸系统, 恰好也遇到了这个问题, 又恰好懒得多想, 可以直接把整个索引删掉, 不会对业务有任何影响, 但历史数据就没了 :
1 curl -s -u user:passwd -X DELETE "localhost:9200/esb_api_log_community"
如果你想在给Leader汇报的时候多说几句, 就可以说你利用异步调用的方法, 而且多线程执行, 一边删除一边刷新, 用了n个小时, 把索引里面90天以前的文档都删除了, 释放了xxx空间:
1 curl -s -u user:passwd -X POST -H "Content-Type: application/json" "http://localhost:9200/esb_api_log_community/_delete_by_query?wait_for_completion=false&refresh=true&slices=auto&pretty" -d'{"query": {"range": {"@timestamp": {"lte": "now-90d"}}}}'
架构信息 在笔者所使用的的环境中, ES集群由三个节点组成, 使用版本:7.6.1
1
2
3
4
5
# curl -s -u user:passwd -X GET "192.168.255.108:9200/_cat/nodes?v" ip heap.percent ram.percent cpu load_1m load_5m load_15m node.role master name 192.168.255.107 45 86 11 0.14 0.12 0.14 dilm * elasticsearch-1 192.168.255.106 49 90 11 0.07 0.08 0.07 dilm - elasticsearch-0 192.168.255.108 24 90 2 0.10 0.07 0.10 dilm - elasticsearch-2
排查 确认ES的账号密码 最初是使用安装脚本自动安装包括ES在内的整个蓝鲸系统后台, 所以需要从当初自动配置的安装脚本里面找到ES的用户密码.
根据业务流程, 我们知道, 蓝鲸系统的监控平台需要调用ES, 所以我们大概率可以在bkmonitor的相关配置文件中找到ES的账号密码.
在笔者所使用的环境中, 密码信息保存在监控平台服务的主机上, 文件是/data/bkee/bkmonitorv3/monitor/bin/environ.sh.
查看索引概况 状态查看 前面有提到, 索引体积巨大, 但状态还是green的, 服务运行正常.
1
2
3
4
5
# curl -s -u username:password -X GET "192.168.255.108:9200/_cat/indices?v" health status index uuid pri rep docs.count docs.deleted store.size pri.store.size ... green open esb_api_log_community xxxxxxxxxxxxxxxxxxxxxx 1 1 192079624 0 254.8gb 127.7gb ...
查看索引中的文档内容 先看看都有什么字段:
1 curl -s -u user:password -X GET "192.168.255.106:9200/esb_api_log_community/_mapping?pretty"
然后, 我们可以随便抽一条数据看看:
1 # curl -s -u user:password -X GET "192.168.255.108:9200/esb_api_log_community/_search?size=1&pretty" -H 'Content-Type: application/json' -d '{"query":{"exists":{"field":"input_type"}}}'
会返回一条json格式的文档:
1
2
3
4
5
6
7
8
9
10
11
12
13
14
15
16
17
18
19
20
21
22
23
24
25
26
27
28
29
30
31
32
33
34
35
36
37
38
39
40
41
42
43
44
45
46
47
48
49
50
51
52
53
54
55
56
{ "took" : 4 , "timed_out" : false , "_shards" : { "total" : 1 , "successful" : 1 , "skipped" : 0 , "failed" : 0 }, "hits" : { "total" : { "value" : 10000 , "relation" : "gte" }, "max_score" : 1.0 , "hits" : [ { "_index" : "esb_api_log_community" , "_type" : "_doc" , "_id" : "MxeDPoIBww7zV8rlZXU2" , "_score" : 1.0 , "_source" : { "type" : "pyls-comp-request" , "req_end_time" : "2022-07-27 07:16:09" , "source" : "/data/bkee/logs/open_paas/esb_api.log" , "req_username" : "admin" , "input_type" : "log" , "beat" : { "version" : "5.2.0" , "hostname" : "blueking-10" , "name" : "beat_paas_esb_api" }, "req_component_name" : "metadata_get_data_id" , "@timestamp" : "2022-07-27T07:16:10.775Z" , "req_start_time" : "2022-07-27 07:16:08" , "req_status" : 3 , "tags" : [ "beat" , "esb_api" ], "offset" : 51559849 , "req_params" : "{\"bk_app_code\": \"bk_bkmonitorv3\", \"bk_data_id\": \"1000\", \"bk_username\": \"admin\", \"bk_app_secret\": \"xxxxxxxxx\"}" , "request_id" : "8bb24db90bb2400fb1ae75a3bacf6884" , "req_msecs_cost" : 55 , "req_use_test_env" : false , "req_client_ip" : "192.168.255.101" , "@version" : "1" , "req_system_name" : "MONITOR_V3" , "req_message" : "OK" , "message" : "ESB request finished, method=GET system=MONITOR_V3 component=metadata_get_data_id" , "req_app_code" : "bk_bkmonitorv3" } } ] } }
查看索引模板 先看看这个索引是不是关联到某个索引模板:
1
2
3
4
5
# curl -s -u user:password -X GET "http://192.168.255.108:9200/_cat/templates?v" name index_patterns order version ... paas_esb_api_tpl_1 [esb_api_log_community] 0 ...
再看看这个索引模板有没有什么特别的设置:
1
2
3
4
5
6
7
8
9
10
11
12
13
14
15
16
17
# curl -s -u user:password -X GET "http://192.168.255.108:9200/_template/paas_esb_api_tpl_1?pretty" { "paas_esb_api_tpl_1" : { "order" : 0, "index_patterns" : [ "esb_api_log_community" ], "settings" : { }, "mappings" : { "properties" : { "offset" : { ...省略... } }, "aliases" : { } } }
很遗憾, 没有.
也就是说, 这个索引是默认的1 primary shard, 1 replica shard. 没有设置alias, 没有rollover, 没有lifecycle.
refresh interval使用的是默认值1s.
Maybe this is why it can grow up to 250GB.
梳理业务逻辑 根据上面的数据返回, 我们可以知道, 这里记录的都是一些日志文件内容. 在记录日志文件的同时, 也会在ES中保存一份.
而且, 记录的都只是蓝鲸系统自身运行的一些日志数据, 所以在前面才说道可以直接删除, 不影响业务. 直接删除之后, 因为有索引模板, 所以系统也很快会自己重新创建一个配置相同的索引出来.
数据清理方案 尽管数据不重要, 但基于安全稳妥的角度, 可以先把90天以前的文档删除了.
性能考虑 我们可以先确认一下, 要删除的数据大概有多少条:
1 curl -s -u user:password -X GET -H "Content-Type: application/json" "http://192.168.255.108:9200/esb_api_log_community/_count?pretty" -d'{"query": {"range": {"@timestamp": {"lte": "now-90d"}}}}'
有1.5亿条数据, 这就必须多做一些考虑了.
1
2
3
4
5
6
7
8
9
{ "count" : 153398981 , "_shards" : { "total" : 1 , "successful" : 1 , "skipped" : 0 , "failed" : 0 } }
要删除的数据过多, 估计需要数小时才能完成, 所以要异步执行, 设置wait_for_completion=false
为了避免在删除过程中大概率会出现的version conflict错误, 需要加上refresh选项.
从数据完整性的角度看, 笔者还推荐考虑一下wait_for_active_shards参数, 但在本例中, 暂时不加
为了加快删除的速度, 我们还可以填一个slices选项
执行 最后, 提交delete-by-query异步执行请求:
1 2 curl -s -u user:passwd -X POST -H "Content-Type: application/json" "http://192.168.255.108:9200/esb_api_log_community/_delete_by_query?wait_for_completion=false&refresh=true&slices=auto&pretty" -d'{"query": {"range": {"@timestamp": {"lte": "now-90d"}}}}'
系统会返回一个task_id:
1
2
3
{ "task" : "Z8K7Q0HuTiulCUGiAA4Cpg:599765945" }
可以通过_taskapi, 查看任务的进展:
1 curl -s -u user:password -X GET "http://192.168.255.108:9200/_tasks/Z8K7Q0HuTiulCUGiAA4Cpg:599765945?pretty"
验收 在本例中, 当这个delete-by-query请求完成后, task的状态返回如下:
1
2
3
4
5
6
7
8
9
10
11
12
13
14
15
16
17
18
19
20
21
22
23
24
25
26
27
28
29
30
31
32
33
34
35
36
37
38
39
40
41
42
43
44
45
46
47
48
49
50
51
{ "completed" : true, "task" : { "node" : "Z8K7Q0HuTiulCUGiAA4Cpg", "id" : 599765945, "type" : "transport", "action" : "indices:data/write/delete/byquery", "status" : { "total" : 153398981, "updated" : 0, "created" : 0, "deleted" : 153398981, "batches" : 153399, "version_conflicts" : 0, "noops" : 0, "retries" : { "bulk" : 0, "search" : 0 }, "throttled_millis" : 0, "requests_per_second" : -1.0, "throttled_until_millis" : 0 }, "description" : "delete-by-query [esb_api_log_community]", "start_time_in_millis" : 1677572853052, "running_time_in_nanos" : 40851043303243, "cancellable" : true, "headers" : { } }, "response" : { "took" : 40851036, "timed_out" : false, "total" : 153398981, "updated" : 0, "created" : 0, "deleted" : 153398981, "batches" : 153399, "version_conflicts" : 0, "noops" : 0, "retries" : { "bulk" : 0, "search" : 0 }, "throttled" : "0s", "throttled_millis" : 0, "requests_per_second" : -1.0, "throttled_until" : "0s", "throttled_until_millis" : 0, "failures" : [ ] } }
简单来说, 就是用了10多个小时, 每1000条数据一个batch, 全部删除掉了, 没有报错.
删除完了之后, 索引还是有将近30GB(摊手):
1
2
health status index uuid pri rep docs.count docs.deleted store.size pri.store.size green open esb_api_log_community xxxxxxxxxxxxxxxxxxxxxw 1 1 38880263 8429501 60.7gb 29.9gb
保险起见, 还再看看新的数据有没有继续入库:
1 curl -s -u user:password -X GET -H "Content-Type: application/json" "http://192.168.255.108:9200/esb_api_log_community/_search?size=2&pretty" -d'{"query": {"range": {"@timestamp": {"gte": "now-30s"}}}}'
再盯一下ES的常规监控, 无恙.
后记 正如我在开头TL;DR里面提到的, 这是一句curl命令就能做完的东西, 但是背后的排查思路和方案打磨过程, 还是值得好好写写.
用10秒钟写完一条命令, 再用1个小时跟Leader汇报才是现在摸鱼人的生存方式
最重要的, 还是要熟悉ES的运行机制, 尤其是索引的refresh机制, 同时也要明白索引在ES中的生命周期. 命令倒是次要的, 一搜就能有, 但在执行命令之前, 最好先了解清楚原理.
但话说回来, 其实不应该存在这种体积巨大的index, 正确的做法是通过设置alias和生命周期管理, 让索引自动rollover和删除. 但由于蓝鲸团队官方并没有做这样的设置, 而自己作为商用用户, 也不好随便更改人家的设置. 把告警处理掉, 再向官方报issue才是正确的做法.
扩展阅读 https://www.elastic.co/guide/en/elasticsearch/reference/7.10/near-real-time.html
https://www.elastic.co/guide/en/elasticsearch/reference/7.6/docs-refresh.html
https://www.elastic.co/guide/en/elasticsearch/reference/7.6/index-modules.html#dynamic-index-settings
https://www.elastic.co/guide/en/elasticsearch/reference/7.6/tasks.html
https://www.elastic.co/guide/en/elasticsearch/reference/7.6/docs-delete-by-query.html#docs-delete-by-query
https://www.elastic.co/guide/en/elasticsearch/reference/current/tune-for-indexing-speed.html
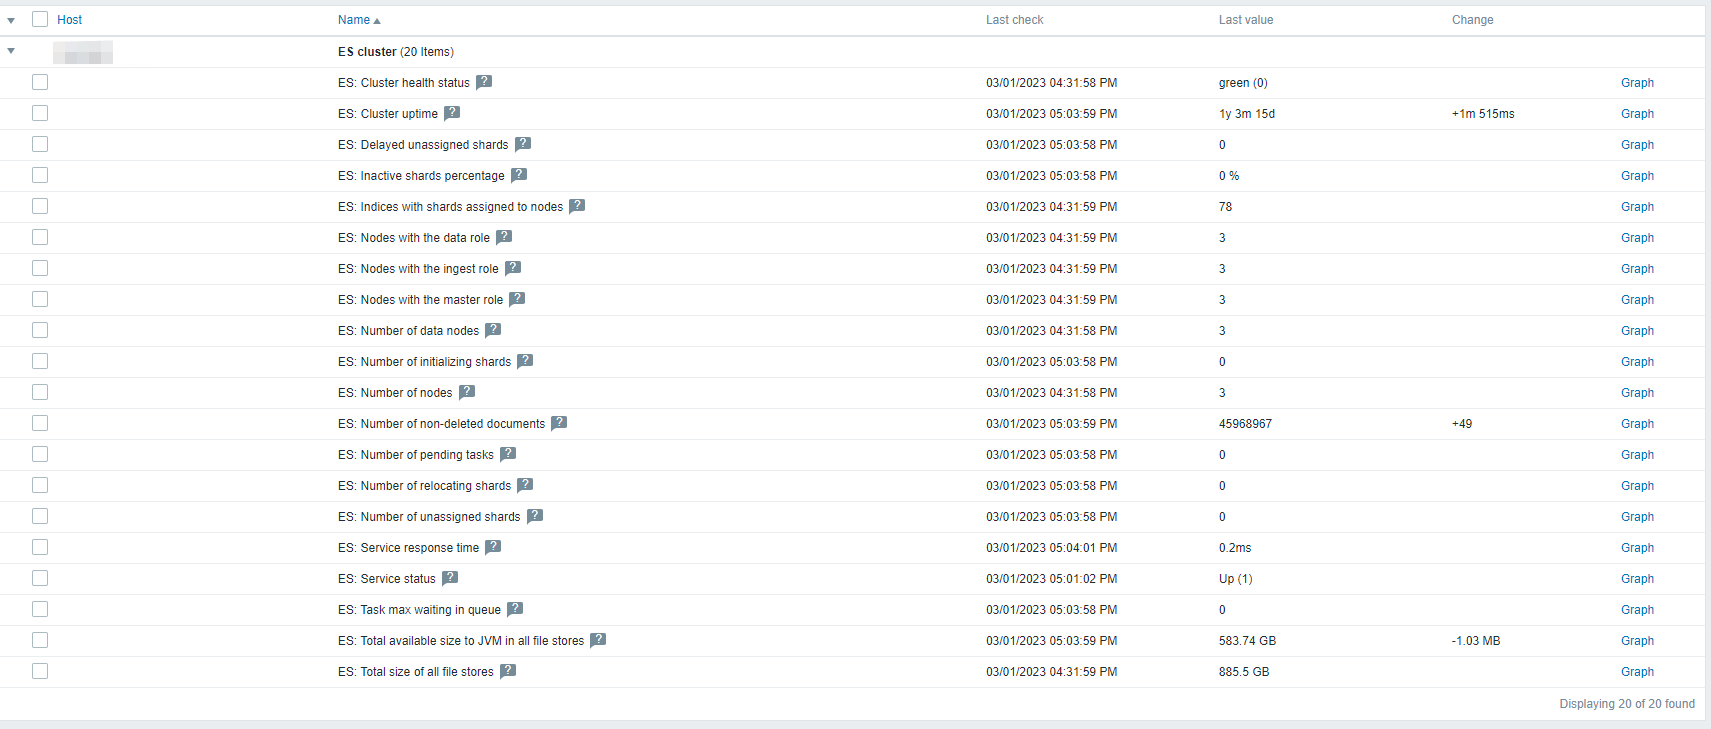
拾遗 想起上一篇文章里面提到的用Zabbix官方提供的现成模板监控MySQL的事情, 其实Elasticsearch都有现成的Zabbix监控模板.
配置起来也是差不多. 但出于信息安全的角度, 最好还是提前给ES集群创建一个只读账户.
在本例中, 笔者操作如下:
1 2 3 4 5 6 7 8 9 10 11 12 13 14 15 16 17 18 19 20 21 curl -u admin-user:password -X POST "http://192.168.255.106:9200/_security/role/read_only?pretty" -H 'Content-Type: application/json' -d' { "cluster": ["all"], "indices": [ { "names": ["*"], "privileges": ["read"] } ] } ' curl -X POST -u admin-user:password "http://192.168.255.106:9200/_security/user/zbx_monitor?pretty" -H 'Content-Type: application/json' -d' { "password" : "my-password", "roles" : [ "read_only" ] } '
其余的, 就都在ZabbixWeb上面设置就可以了. 官方的监控模板覆盖得很全面, 也是大量使用自动发现完成:
ref:https://git.zabbix.com/projects/ZBX/repos/zabbix/browse/templates/app/elasticsearch_http/README.md?at=release%2F5.0
https://www.elastic.co/guide/en/elasticsearch/reference/7.6/security-api-put-user.html
https://www.elastic.co/guide/en/elasticsearch/reference/7.6/security-api-put-role.html